OPC UA Server Performance Considerations
Introduction
General
system:inmation provides a Server service component that can expose various types of data through the different interfaces implementing the different OPC specifications DA, HDA, A&E, and UA.
This document describes the usage of the OPC UA Server interface in terms of
-
Performance limits
-
Recommended UA client setup
Note: the current version of this document focuses on Data Access only, and does not take Alarms+Conditions into account.
Who should read this
The content of this document addresses roles that are responsible for configuring 3rd party applications or services to connect to the inmation OPC UA Server and to read data from it.
Some detailed knowledge about OPC UA communication in general is expected, as well as awareness of the typical terms and abbreviations used in the OPC UA specification.
Additionally being familiar with system:inmation’s configuration of the server model and the interpretation of its performance counters is required.
Recommended OPC UA Architecture
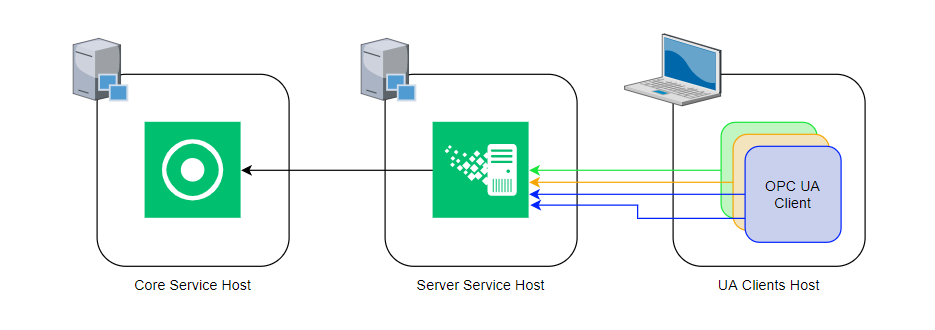
Distribution of Services
If possible always host the inmation OPC UA Server service on a dedicated OS, not sharing resources with the Core. This will prevent a concurrency of the services for CPU and memory and distribute load for data processing and providing to multiple hosts.
OPC UA Client Setup
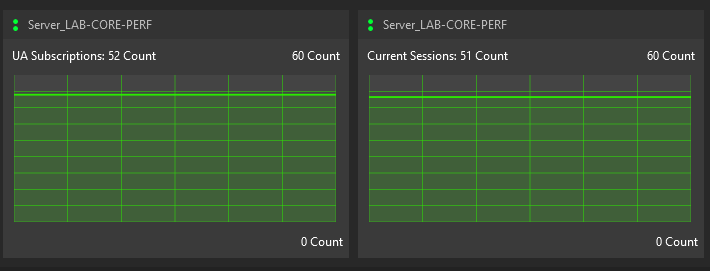
OPC UA clients can create multiple sessions that each can consist of multiple subscriptions. In order to leverage from multiple CPU cores and parallel real time channels on the UA Server side, it is recommended to always use multiple subscriptions within a session.
For a high throughput of data changes per second use multiple subscriptions and multiple sessions (typically equals clients).
Note: Our testing environments use the .Net Core OPC UA client libraries. In our tests this client was not able to handle more then ~35.000 monitored items changing every second .
(https://github.com/OPCFoundation/UA-.NETStandard-Samples )
system:inmation Realtime Channel Communication
Explanation
The Server service acting as OPC UA server starts requesting data from the Core service, when an OPC UA client creates a session and a subscription with monitored items. The communication between the two services is based on the internal inmation protocol SPROX, specifically the real time channel within it.
A real time channel is limited in throughput by the network latency between the two services, the available network bandwidth, and the CPU power required to communicate data over the TCP layer.
In low latency network environments (LAN, latency < 50ms) the maximum throughput is approximately 50.000 scalar numeric data points per second per real time channel.
Note: Non numeric data points, e.g. strings, can significantly vary in size and therefore can not be estimated very well. Since these types are typically of larger size they will lower the maximum throughput accordingly.
Parallel Realtime Channels
The Server service can open multiple real time channels to the Core in parallel. For each OPC UA session a separate channel will be opened.
Multiple subscriptions within one session will be processed in parallel, leveraging from the availability of multiple CPU cores. The total number of data points per second must not exceed the number of available CPU cores times 50.000.
For example a 4 CPU Server host must not exceed 200.000 data points changes per second in total.
Useful Performance Counters
This section lists the inmation performance counters that are useful do diagnose the current utilization of the OPC UA server and the real time communication being used.
Core Service
Hardware / Host CPU Load & Hardware / inmation CPU Load
Used to determine if the Core is busy sending the data to the Server service. Be sure to compare the CPU load without and including the OPC UA Server service requesting data.
Also make sure you compare the inmation CPU Load with the host’s overall CPU load to understand if other processes are limiting the utilization of the CPUs.

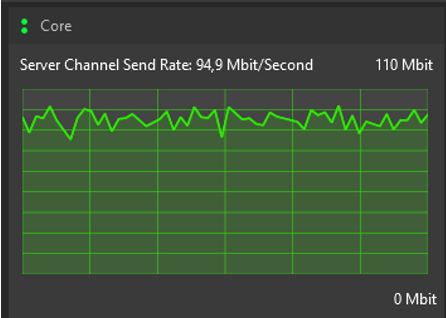
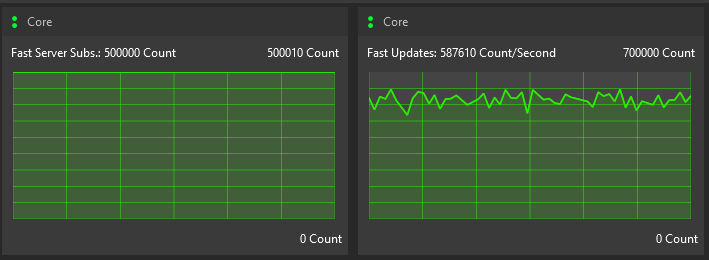
Channel Diagnostics / Server Channel Send Rate
Sum of data that is send out to Server services. A flat line at high level can hint towards a bandwidth limitation.
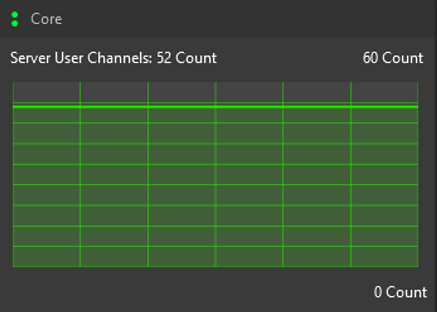
Channel Diagnostics / Server User Channels
The sum of number of channels from Core to Server services.
Server Service
Hardware / Host CPU Load & Hardware / inmation CPU Load
Used to determine if the Server service is busy requesting data from the Core and processing it.
Make sure to compare the inmation CPU Load with the host’s overall CPU load to understand if other processes are limiting the utilization of the CPUs.

Channel Diagnostics / Current Lag Time
The network lag between Server service and the Core. A high lag > 100 ms can have a significant impact on the amount of data points that can be transferred from Core to Server.